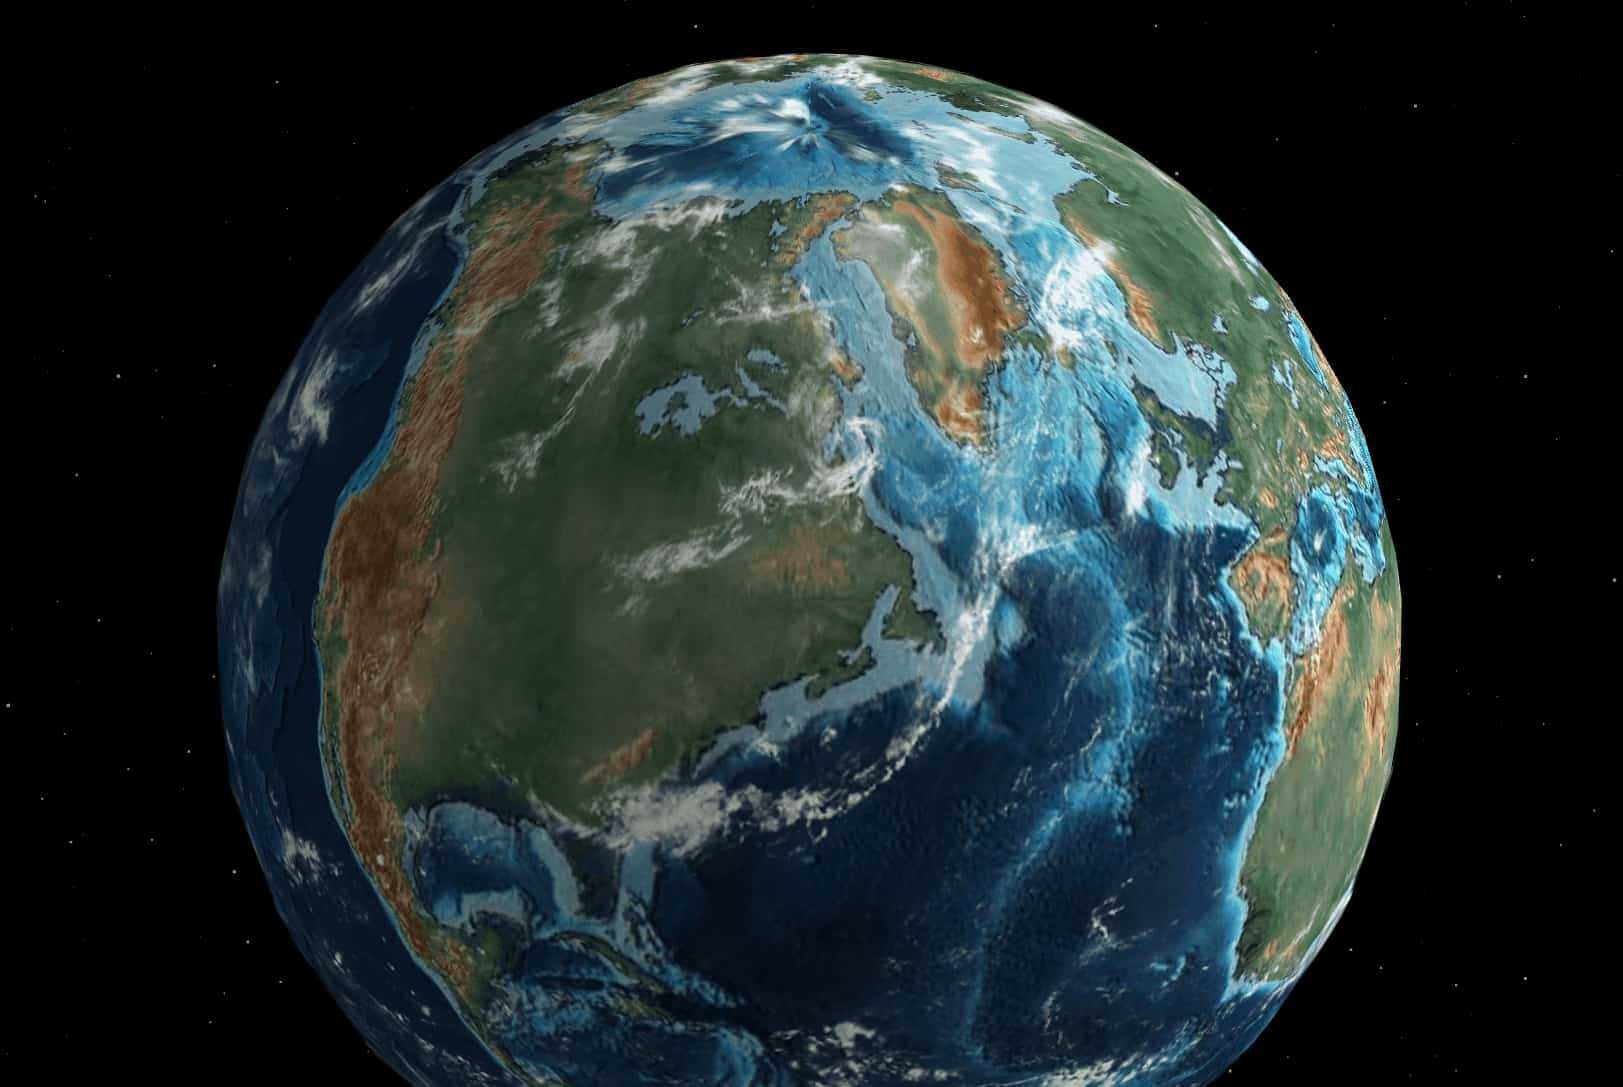
Reconstruction of Earth 35 million years ago. Credit: C.R. Scotese and Ian Webster
The Future of 35 Million Years Ago
By Mike McDearmon
Jan 15, 2020 | 7 min read
Humans are putting CO2 into the atmosphere really fast - about 100 times faster than previous natural increases [1]. While we know that the planet is warming as a result, we also know that for much of the Earth's history the global climate was warmer than it is today. That might seem comforting, but clues from the fossil record offer glimpses into warmer worlds of the past that would seem like alien planets to a civilization built on 10,000 years of cool stability.
One of the closest historic analogs for where we may be heading soon is the Eocene epoch, spanning 55 to 35 million years ago. Still recent in geologic terms, the shape and configuration of the continents would look more or less as it does today, save for a few differences on closer inspection: a narrower Atlantic ocean, the British Isles still clinging to mainland Europe, and the islands of Canada's Arctic Archipelago all huddled together and joined to the Canadian mainland [2].
The climate of the Eocene, however, was much warmer than Earth as we know it today. The contrast is clearest at the poles, where there were no permanent ice sheets. Instead, the Arctic circle looked more like today's southeastern United States with temperate forests that were home to alligators, snakes, and early primates [3].
Driving the warm Eocene climate was the high concentration of CO2 in the atmosphere. As noted in the US Global Change Research Program's Fourth National Climate Assessment: "During the Eocene... CO2 levels were between 680 and 1260 ppm [parts per million], or somewhere between two and a half to four and a half times higher than preindustrial levels" [4].
Atmospheric CO2 concentration 40 million to 900,000 years ago
This chart shows a gradual decrease in CO2 concentration (measured in parts per million or ppm) from the relative hot house of the Eocene to a more familiar, cooler climate. These estimated CO2 levels come from a 2013 sediment analysis [5].
After the Eocene, atmospheric CO2 began to gradually decrease and global temperatures fell as a result. Exactly what caused this drawdown is the subject of recent study, but evidence points to the rise of the Himalayan mountain range as a key contributing factor [6]. Beginning their ascent 50 million years ago, the Himalayas contributed to global cooling by pulling CO2 out of the atmosphere through chemical weathering and by increasing the planet's solar reflectivity as they buried a vast area of the Earth's surface in snow and ice.
The gradual downslope of post-Eocene CO2 levels hit a low point 2.5 million years ago at the start of the Pleistocene, more commonly known as the Ice Age. CO2 levels for the most recent 800,000 years of the Ice Age are shown in the chart below, continuing the CO2 storyline about 100,000 years after the previous chart ends.
Atmospheric CO2 concentration 800,000 years ago to present
Showing CO2 levels from 800,000 years ago to the present, this chart combines Antarctic ice core data from 800,000 years ago to 150 years ago [7] with measurements at the Mauna Loa observatory recorded from 1959 to today [8].
This dataset shows the sawtooth pattern of CO2 levels that occurred throughout much of the Pleistocene. These oscillations in CO2, minor as they are compared to the much larger drawdown from the Eocene, were large enough to swing the planet back and forth between periods of glacial advance and retreat from the poles. The entirety of human civilization has developed during the most recent of these glacial retreats.
Because no major changes have occurred in energy output from the sun, the orbit of the Earth, or its physical and chemical activity, the pattern of glacial freeze and thaw was poised to continue before humans began burning fossil fuels for energy. The near-vertical spike in CO2 levels over the last 260 years shows just how exceptional the modern emissions rate is relative to almost a million years of records stored in polar ice.
Atmospheric CO2 concentration 10,000 years to present
When the timescale of the previous chart is cropped to the last 10,000 years—the birth of human civilization to today—the impact of industrialized fossil fuel emissions is visible. Also striking in this snapshot is the relative stability of the pre-industrial climate.
While this period encompasses everything humans have ever accomplished since the dawn of agriculture—a veritable eternity from a human point of view—this stretch of climate stability is so brief in geologic terms that it's hardly visible on the 800,000 year timeline.
Atmospheric CO2 concentration 1959 to present
The meteoric rise of modern CO2 levels stands out on any chart showing more than a few hundred years of history, but when zoomed into the human timescale it's easier to understand why changes can feel slow or undetectable in the span of a single generation.
The impacts of emissions are revealing themselves over decades, a rate that tragically masks cause from effect for the majority of the developed world. It doesn't help that CO2 itself is odorless and invisible in the atmosphere. Global warming is a story unfolding in slow motion—a story of relentless, nearly imperceptible changes playing out beyond the human scale.
Atmospheric CO2 concentration 800,000 years ago to 2100 (Projected)
The physics of CO2's heat-absorbing nature having been established in the 1850s, one of the few certainties about the near future is that it will be warmer. Exactly how much warmer is impossible to predict given uncertainties in what humans will do in the future, and how the climate system will react.
To illustrate this uncertainty, the chart above plots three scenarios for CO2 concentration in the year 2100 from the US Global Change Research Program called Representative Concentration Pathways (RCPs). In the two lower scenarios, RCP2.6 (purple) and RCP4.5 (teal), CO2 concentration rises to 450 and 550 ppm, respectively. These two scenarios assume drastic measures are taken to decrease CO2 emissions over the next few decades.
The highest of these scenarios, RCP8.5 (red), "corresponds to a future where carbon dioxide and methane emissions continue to rise as a result of fossil fuel use, albeit with significant declines in emission growth rates over the second half of the century" [4]. CO2 concentration under this scenario would reach 936 ppm, with average global temperatures increasing by 5.4°–9.9°F (3°–5.5°C) relative to the 1986-2005 average.
Atmospheric CO2 concentration 40 million years ago to 2100 (Projected)
This final chart shows the same three RCP scenarios in context of the last 40 million years of CO2 levels. All three scenarios would mean a return to climate conditions not seen on Earth in over 20 million years—conditions that would gradually melt Arctic ice sheets, change coastlines around the world, force changes to cities and infrastructure, and alter the distribution of food and fresh water around the world.
The two lower scenarios would certainly test the adaptability of civilization as we know it, but the higher RCP8.5 scenario would require adjusting to a truly altered world. It would mean a shift from Ice Age to Eocene climate, a reversal of a cooling trend millions of years long in just a handful of human generations [9].
- Rebecca Lindsey, Climate Change: Atmospheric Carbon Dioxide, Climate.gov, 2019
- C.R. Scotese and Ian Webster, Ancient Earth Globe, Accessed: Jan 6, 2020
- Guy J. Harrington, Jaelyn Eberle, Ben A. Le-Page, Mary Dawson and J. Howard Hutchinson, Arctic plant diversity in the Early Eocene greenhouse, The Royal Society B: Biological Sciences, 2011
- Hayhoe, K., J. Edmonds, R.E. Kopp, A.N. LeGrande, B.M. Sanderson, M.F. Wehner, and D.J. Wuebbles, 2017: Climate models, scenarios, and projections. In: Climate Science Special Report: Fourth National Climate Assessment, Volume I, US Global Change Research Program, 2017
- Yi Ge Zhang, Mark Pagani, Zhonghui Liu, Steven M. Bohaty and Robert DeConto, A 40-million-year history of atmospheric CO2, The Royal Society A: Mathematical, Physical and Engineering Sciences, 2013
- Holli Riebeek, The Carbon Cycle, NASA Earth Observatory, 2011
- Dieter Luthi, et al., EPICA Dome C Ice Core 800KYr Carbon Dioxide Data, NOAA/NCDC Paleoclimatology Program, 2008
- Ed Dlugokencky and Pieter Tans, Mauna Loa CO2 annual mean data, NOAA/ESRL, 2019
- K. D. Burke, J. W. Williams, M. A. Chandler, A. M. Haywood, D. J. Lunt, B. L. Otto-Bliesner, Pliocene and Eocene provide best analogs for near-future climates, Proceedings of the National Academy of Sciences of the United States of America, 2018