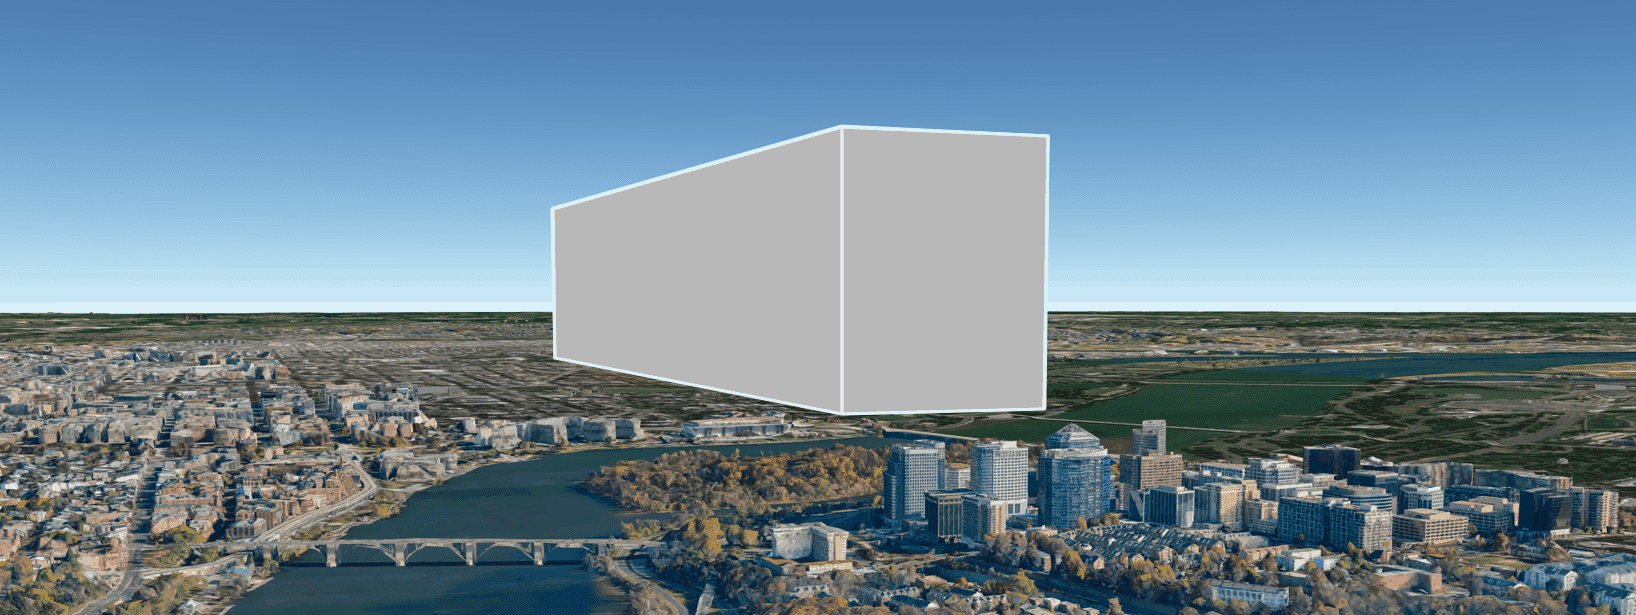
The size of roughly a gigaton of ice sitting atop the National Mall in Washington, DC. An estimated 28,000 gigatons have melted on Earth since 1994.
Gigatons: the Measure of Climate Change
By Mike McDearmon
Apr 22, 2021 | 4 min read
Climate scientists often use the gigaton (one billion tons) to measure greenhouse gas emissions, glacier melt, and other chemical changes related to global climate. The gigaton is a unit of measure with few practical applications. At the human scale, it’s so massive that it almost has no meaning. Yet at the planetary scale a gigaton is trivial; the atmosphere alone weighs about 5 and a half million gigatons which is roughly one millionth of Earth’s total mass [1].
Our climate system may in fact be the sweet spot for the gigaton. It’s the scale at which rapid changes begin to nudge the system and trigger cascading effects or feedbacks. As climate scientists are observing, adding several gigatons of carbon dioxide to the atmosphere year after year is trapping heat which causes ripple effects as the planet warms. For example, that excess heat is causing ice sheets to recede and release gigatons of fresh water into the ocean. This in turn changes the chemistry and temperature of the ocean which leads to further changes, and so on.
To understand the gigaton is to understand the impact humans are having on the planet, but examples of gigaton-sized objects on which to base our understanding are not easy to come by. Our cities, it turns out, can offer some perspective. Meredith Nettles, Professor of Earth and Environmental Sciences at Columbia University, offers this description of a gigaton of ice: “If you took the whole National Mall, and covered it up with ice, to a height about four times as high as the [Washington] monument… all the way down from the Capitol steps to the Lincoln Memorial” [2] the result would weigh about a gigaton.
1 gigaton of ice would fill the National Mall up to the height of 4 Washington Monuments standing on end.
Now that we can picture a gigaton of ice, let’s look at how much is melting. In less than three decades from 1994 to 2020, Earth has lost a total of 28 thousand gigatons of ice [3]. If you were to clone our National Mall sized ice block 28,000 times, you could cover an area roughly equivalent to Vermont and Massachusetts in over 2,000 feet of ice.
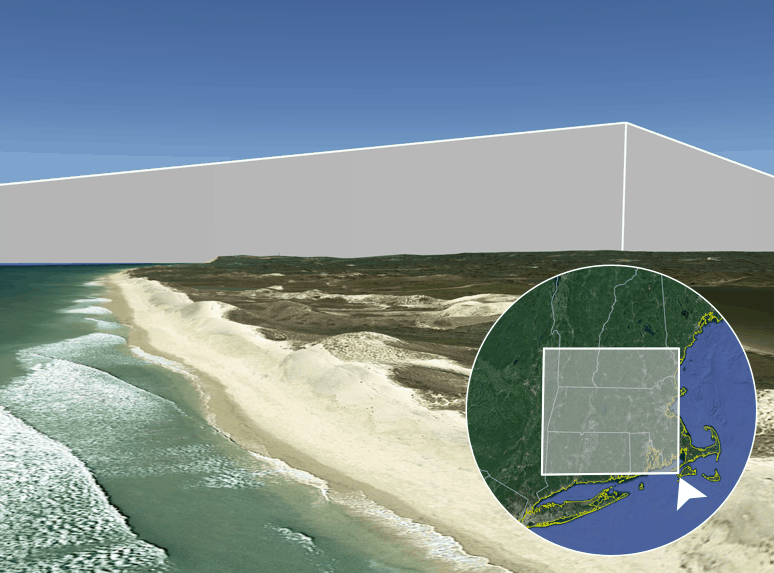
What it would look like to gaze up at the corner of an ice sheet equivalent to all the ice that has melted on Earth between 1994 and 2020. At a height of just over 2,200 feet, this ice sheet would have a 19,600 square mile footprint.
While the vast majority of melting is occuring at the polar ice sheets, the impact to mountain glaciers is perhaps most visible and destabilizing to nearby communities. In Alaska alone, an average of 46 gigatons of ice melted from glaciers each year from 2003 to 2010 [4]. In Europe, the Alps and Caucasus Mountains could lose up to 90% of their ice by the year 2100 under some of the worst greenhouse gas emissions scenarios [5]. In other places like the lower 48 states, mountain glaciers are already past the point of no return. The glaciers of Glacier National Park will be gone by the end of this century no matter what we do [6].
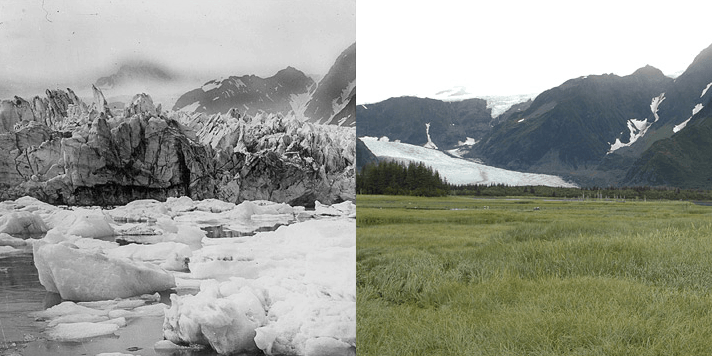
Pedersen Glacier, at Aialik Bay in Alaska’s Kenai Mountains, in 1917 (left) and 2005 (right) [7].
All this ice is melting because we’ve heated up the planet, which we did by taking millions of years of carbon accumulated underground and putting it into the atmosphere in less than 300 years [8]. In total we’ve emitted over 1,500 gigatons of carbon dioxide since 1751, more than half of which went into the sky in just the last three decades [9]. 2019 saw a record high for carbon emissions, totaling just over 43 gigatons [10]. And in 2020 the Coronavirus pandemic, which ended millions of lives and ground economies around the world to near standstill, only slowed the rate of emissions by 7%. That dip is expected to rebound as communities recover from the virus [11].
While decades of multi-gigaton carbon emissions have already set years of warming in motion, each fraction of a degree of global temperature increase is consequential. Each one makes an adaptable future more elusive and, as climate scientist Dr. Katherine Hayhoe puts it, loads the dice against us. Mounting emissions have also led to mounting urgency, making this decade the last shot we have to preserve a future that looks at least somewhat familiar.
- The Editors of Encyclopaedia Britannica, How Much Does Earth’s Atmosphere Weigh?, Encyclopaedia Britannica, 2021
- Chris Mooney, To truly grasp what we’re doing to the planet, you need to understand this gigantic measurement, The Washington Post, 2015
- Thomas Slater, Isobel R. Lawrence, Inès N. Otosaka, Andrew Shepherd, Noel Gourmelen, Livia Jakob, Paul Tepes, Lin Gilbert, and Peter Nienow, Earth’s Ice Imbalance, The Cryosphere, 2021
- NASA Climate 365 project - a collaboration of the NASA Earth Science News Team, NASA Goddard and Jet Propulsion Laboratory communications teams, and NASA websites Earth Observatory and Global Climate Change, Graphic: Dramatic Glacier Melt, Earth Science Communications Team at NASA's Jet Propulsion Laboratory, 2021
- Harry Zekollari, Matthias Huss, and Daniel Farinotti, Modelling the future evolution of glaciers in the European Alps under the EURO-CORDEX RCM ensemble, The Cryosphere, 2019
- Caitlyn Florentine, Erich Peitzsch, Lisa McKeon, Status of Glaciers in Glacier National Park, United States Geologic Survey, 2021
- Rebecca Lindsey, Climate Change: Glacier Mass Balance, NOAA, 2020
- David Herring, Doesn't carbon dioxide in the atmosphere come from natural sources?, NOAA, 2020
- Peter Frumhoff, Global Warming Fact: More than Half of All Industrial CO2 Pollution Has Been Emitted Since 1988, Union of Concerned Scientists, 2014
- Chelsea Harvey, Nathanial Gronewold, CO2 Emissions Will Break Another Record in 2019, Scientific American, 2019
- Emma Newburger, Covid pandemic drove a record drop in global carbon emissions in 2020, CNBC, 2020